

This fall, Shoelace partnered with the research arm of Michigan Virtual to run a pilot to evaluate the efficacy of using Shoelace’s games to tackle the second goal on Michigan’s Top 10 Strategic Education Plan of “Improv[ing] early literacy achievement.” The pilot took place over eight weeks and with 300 students from 13 classes across six different districts recruited through the Michigan Elementary and Middle School Principals Association (MEMSPA).
Here are three key insights from the study, published February 2025:
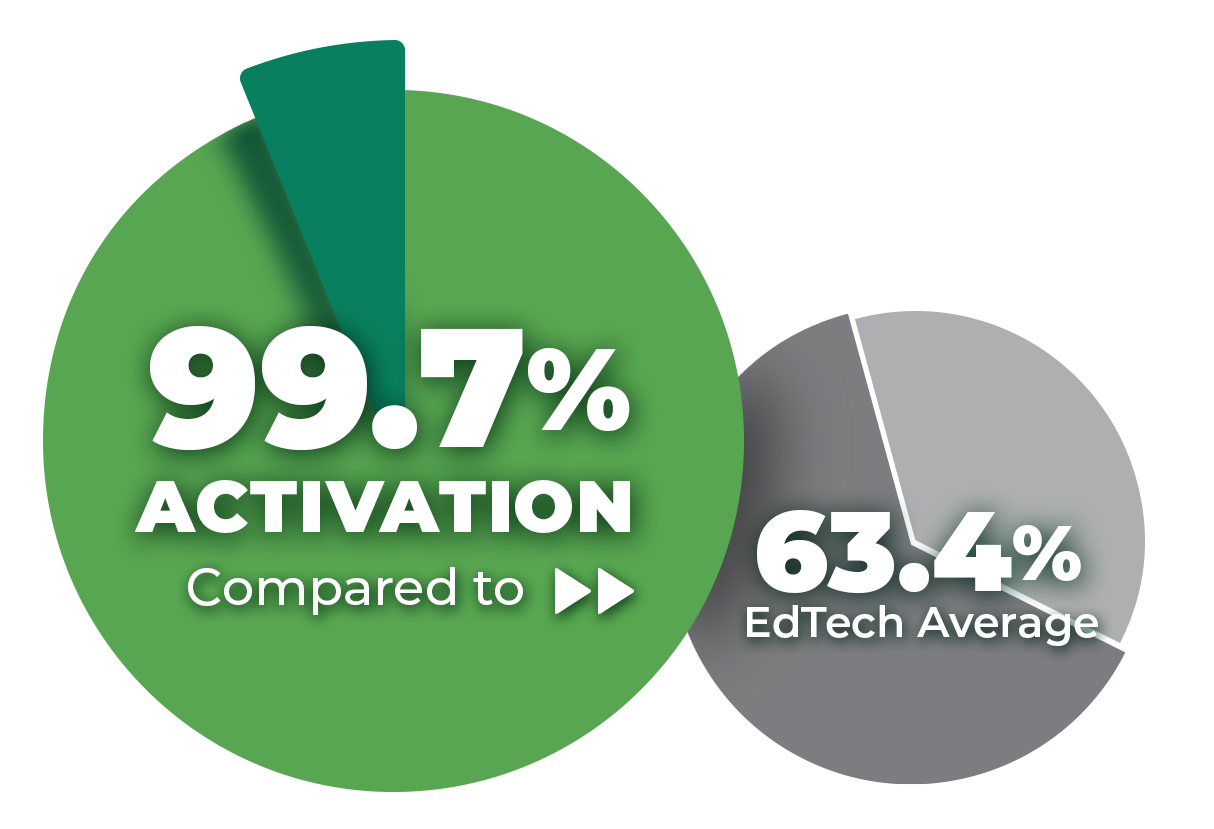
99.7% Student Activation
Stanhope and Rectanus (2015) found that, on average, 63.4% of student licenses are activated across school and district sites. In our pilot, 299 of the 300 students logged into the games and answered at least one question, giving us a stellar 99.7% activation rate! While there was extra motivation for teachers to get their students active (they were participating in a pilot), participation remained high, with weekly participation over 80% for seven of the eight weeks. Not only that, but more than two months after the pilot has ended, over 80% of the players are still playing!

58.7% Students with Full Usage
Getting students onto a platform isn’t enough – it’s important for students to continually engage with the platforms in order to see benefits. At Shoelace, we recommend that players aim to answer a minimum of 25 questions every week. For the pilot, we set a high bar for fidelity and required students to have played for at least 7 of the 8 weeks and averaged ≥25 Learning Moments Delivered per week. Almost 60% of the participating students met this definition of fidelity. This well exceeds the average of 5.2% that Stanhope and Rectanus (2015) found.
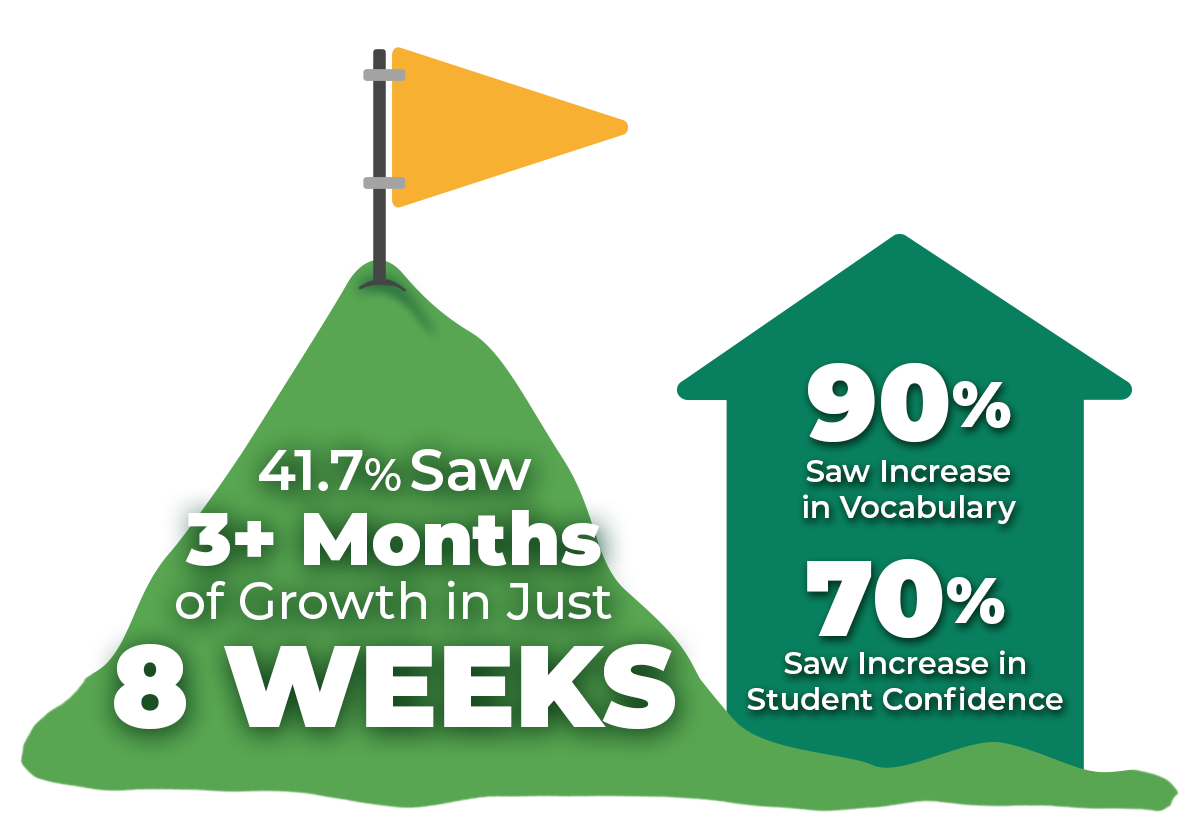
41.7% Students with 3+ Months of Literacy Growth
Using the platform is one thing, but it doesn’t matter if it doesn’t result in learner growth. Of the students who played with fidelity, 41.7% of them showed the equivalent of at least 3 months of literacy growth over the course of the eight-week pilot! The impacts were clear to their teachers, with over 70% stating they saw an increase or significant increase in student confidence, comprehension and fluency and over 90% of them seeing an increase or significant increase in student vocabulary and enjoyment!
The recent drop in NAEP scores underscores the urgent reality of the literacy crisis we are facing. We owe it to learners to adopt innovative solutions that are proven to make a difference. This study demonstrates that when implemented effectively, Shoelace Learning’s platform can deliver transformative results—paving the way for a brighter future and helping to turn the tide on the literacy crisis.
To view the full report and to explore how Shoelace can improve literacy scores in your school, click here.
* Stanhope, D. & Rectanus, K. (2015). Current realities of EdTech use: Research brief. Lea(R)n, Inc.