When teachers are evaluated, the metrics typically focus on student growth or proficiency. In essence, did we make a measurable impact on our students during the year? As a former educator, I understand that, despite our best efforts, delivering the quality of instruction to which we aspire can be challenging. Sometimes, my time was spent coaxing disengaged students to meet baseline expectations, like task completion or compliance.
It can be disheartening, but this is a shared experience for many of us teachers. In fact, our CEO and co-founder, Julia, created Shoelace after observing teachers responding to disengaged student behaviors during classroom visits. Shoelace stands out as a best-in-class, fully game-based learning platform, unlike any other resource on the market. It’s designed to overcome the hurdles of mere compliance and task completion, propelling both you and your students into engaging activities that foster meaningful growth in reading comprehension.
Skeptical? We’ve released a report that helps you track student activity, giving you clear insight into how much they’re learning. As a new user, this will help you gain a sense of the student experience from your dashboard, without having to closely observe all or individual students during class time. Plus, you can use the insights in these reports as evidence of learning: data points you share with your supervisors, with students’ parents and guardians, or for other reporting on your instructional practices.

Measuring Question Count and Accuracy
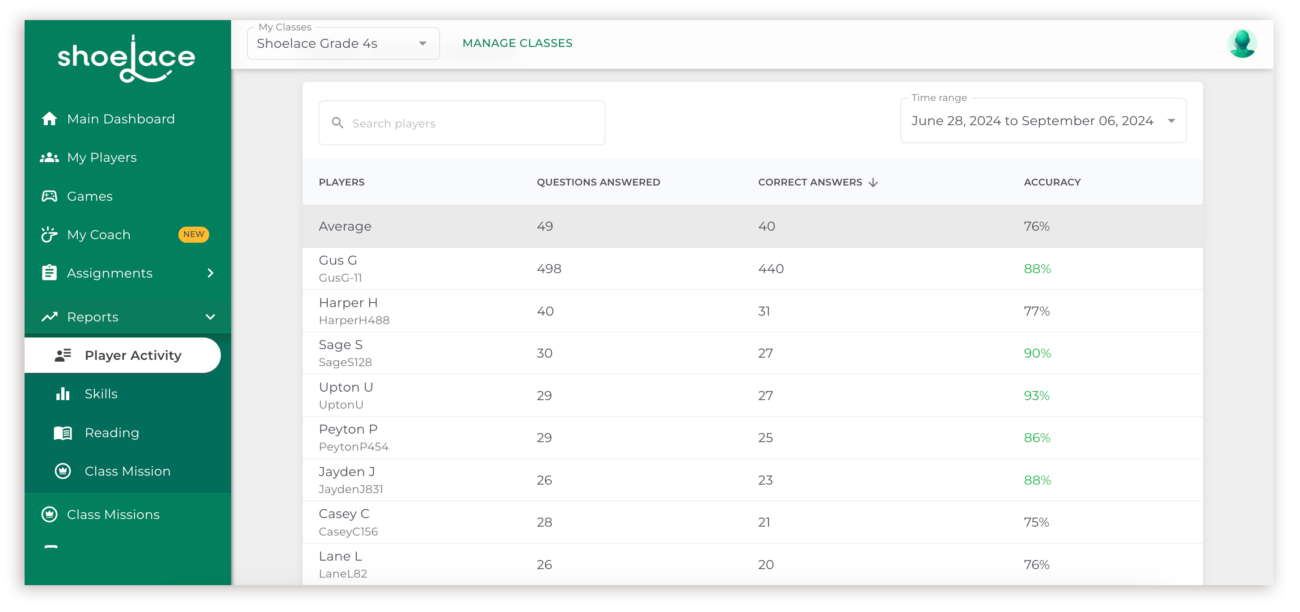
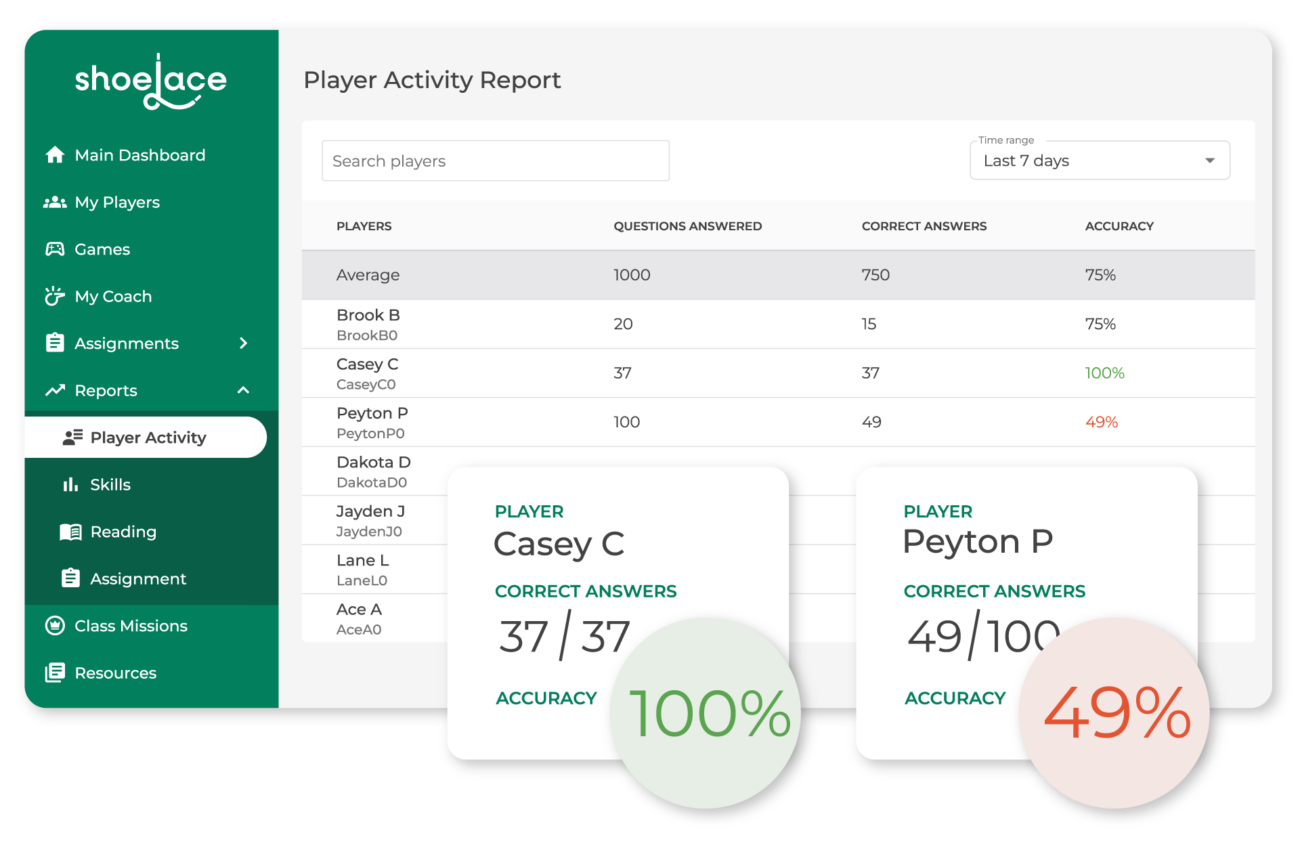
Three stats are provided for each player. First, you can see the number of questions answered. By changing the time range in the top right, you can get a sense of how many questions your students answer per session and per week. Use this data to set completion targets for students, and determine who’s staying on track when they play independently. As a teacher with Durham District School Board in Ontario recently shared with us, “This informs my teaching by showing which students consistently do what is asked of them.” Another teacher noted they were able to use it to get a sense of who was playing outside of school time!
You’ll also see two measures of student accuracy: the number of questions they’ve answered correctly (presented next to the total number they’ve attempted), as well as the corresponding percentage. This is where we can get back to the heart of what we do: helping students make academic strides. 🙌 Use this data to determine which students are excelling and which students are struggling. Educators frequently use this information to determine small-group instruction.

You can also use the student accuracy data to intercede with students who might be guessing rather than giving full effort. Another Durham District School Board teacher describes the player stats on the Player Activity Report as a “quantifiable way to show players the benefit of slowing down and thinking before responding.” In the event you’re seeing accuracy rates that don’t align with how you’ve seen a student perform elsewhere, share the stats with the student and use them as a launchpad to set personalized improvement targets.
Part of an Interconnected Suite of Reports
This report brings a lot of value on its own, but we highly recommend you use it as a starting point. Questions that form from this report (Is this student guessing? What is causing a low accuracy rate for this other student?) can often be answered by looking next at the Skill Report or the My Coach intervention statuses. Click the links in the previous sentence to read more about those reports.